LiteSpeed Ingress Controller Metrics
The LiteSpeed Ingress Controller contains a built-in Prometheus-compatible exporter which can be made available by just activating it. The exporter not only scrapes the /tmp/lslbd/.rtreports file for useful information, but also adds additional value by resolving the backend IP addresses into their exported host names.
Activating Metrics
Metrics control is activated when the LiteSpeed Ingress Controller starts with command line arguments. If you're using Helm, as mentioned in the Controller Configuration, you enable these during the Helm startup by at least specifying --service.metrics.enabled=true:
helm install ls-k8s-webadc ls-k8s-webadc/ls-k8s-webadc -n NAMESPACE --set service.metrics.enabled="true"
This will install the LiteSpeed Ingress Controller with the Prometheus metrics exporter available and its Kubernetes service Annotation set correctly so that an interanl Prometheus node exporter can read the metrics.
The full list of the helm metrics specific parameters are here and the application specific parameters are here.
Using Prometheus' User Interface
Many of the metrics require active connectivity to display any value. Keep that in mind when testing or demonstrating the feature and either choose counter type features or run with gauge features when activity is happening.
The best way to install Prometheus is with helm, into the cluster itself.
$ helm repo add prometheus-community https://prometheus-community.github.io/helm-charts
$ helm install prometheus prometheus-community/prometheus --set server.service.type=NodePort --set server.service.nodePort=30010
Then you can access the Prometheus server from a web browser from the exposed node, at the exposed node port address of 30010.
Accessing Prometheus in a Kubernetes cluster
To then access Prometheus from a web browser, you'll need to find the IP address exposed by the node itself. First get the node name of the running Prometheus server pod:
$ kubectl get pods -o=wide|grep prometheus-server
For example:
prometheus-server-57f4946cdb-x54rh 2/2 Running 0 40h 10.244.3.17 pool-e85y5p9p2-7jkc5 <none> <none>
In column 7, it reports the node that it is running in pool-e85y5p9p2-7jkc5. Remember that name. Then get the list of external IP addresses for your nodes:
$ kubectl get nodes -o=wide
For example:
NAME                   STATUS   ROLES    AGE   VERSION    INTERNAL-IP      EXTERNAL-IP       OS-IMAGE                       KERNEL-VERSION          CONTAINER-RUNTIME
pool-e85y5p9p2-7jkc5   Ready    <none>   5d    v1.21.14   10.136.121.238   159.223.189.158   Debian GNU/Linux 10 (buster)   5.10.0-0.bpo.15-amd64   containerd://1.4.13
pool-e85y5p9p2-7jkck   Ready    <none>   5d    v1.21.14   10.136.121.235   147.182.135.113   Debian GNU/Linux 10 (buster)   5.10.0-0.bpo.15-amd64   containerd://1.4.13
pool-e85y5p9p2-7jkcs   Ready    <none>   5d    v1.21.14   10.136.121.237   137.184.105.17    Debian GNU/Linux 10 (buster)   5.10.0-0.bpo.15-amd64   containerd://1.4.13
In this example see that the pool pool-e85y5p9p2-7jkc5 has external IP address of 159.223.189.158. Since the helm install command line exports the application on port 30010 on that IP, you can bring up a browser and enter in the url: http://[YOUR IP ADDRESS]:30010, which in this example is: http://159.223.189.158:30010:
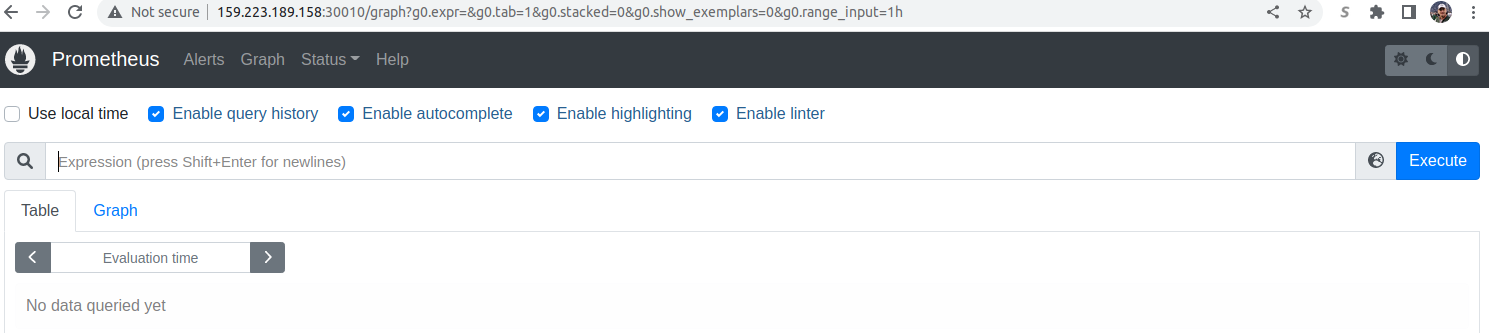
To see the list of options, press the icon between the Expression text box and the Execute button, look for entries that begin with litespeed_:
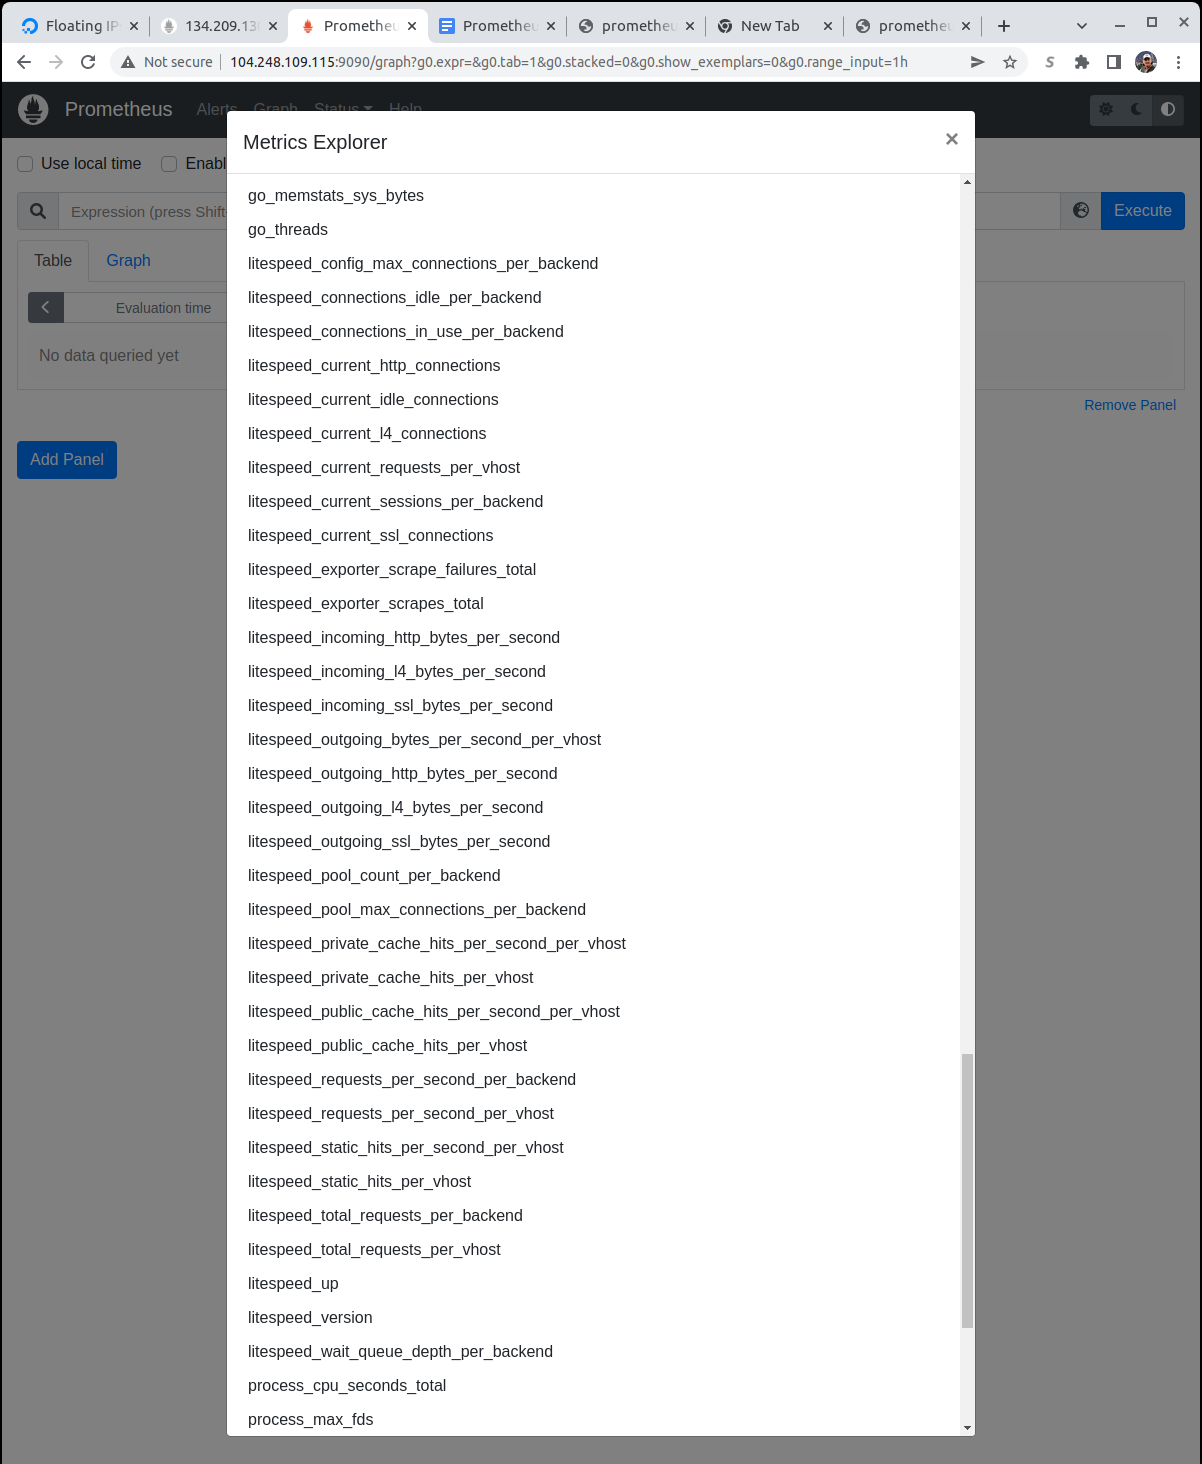
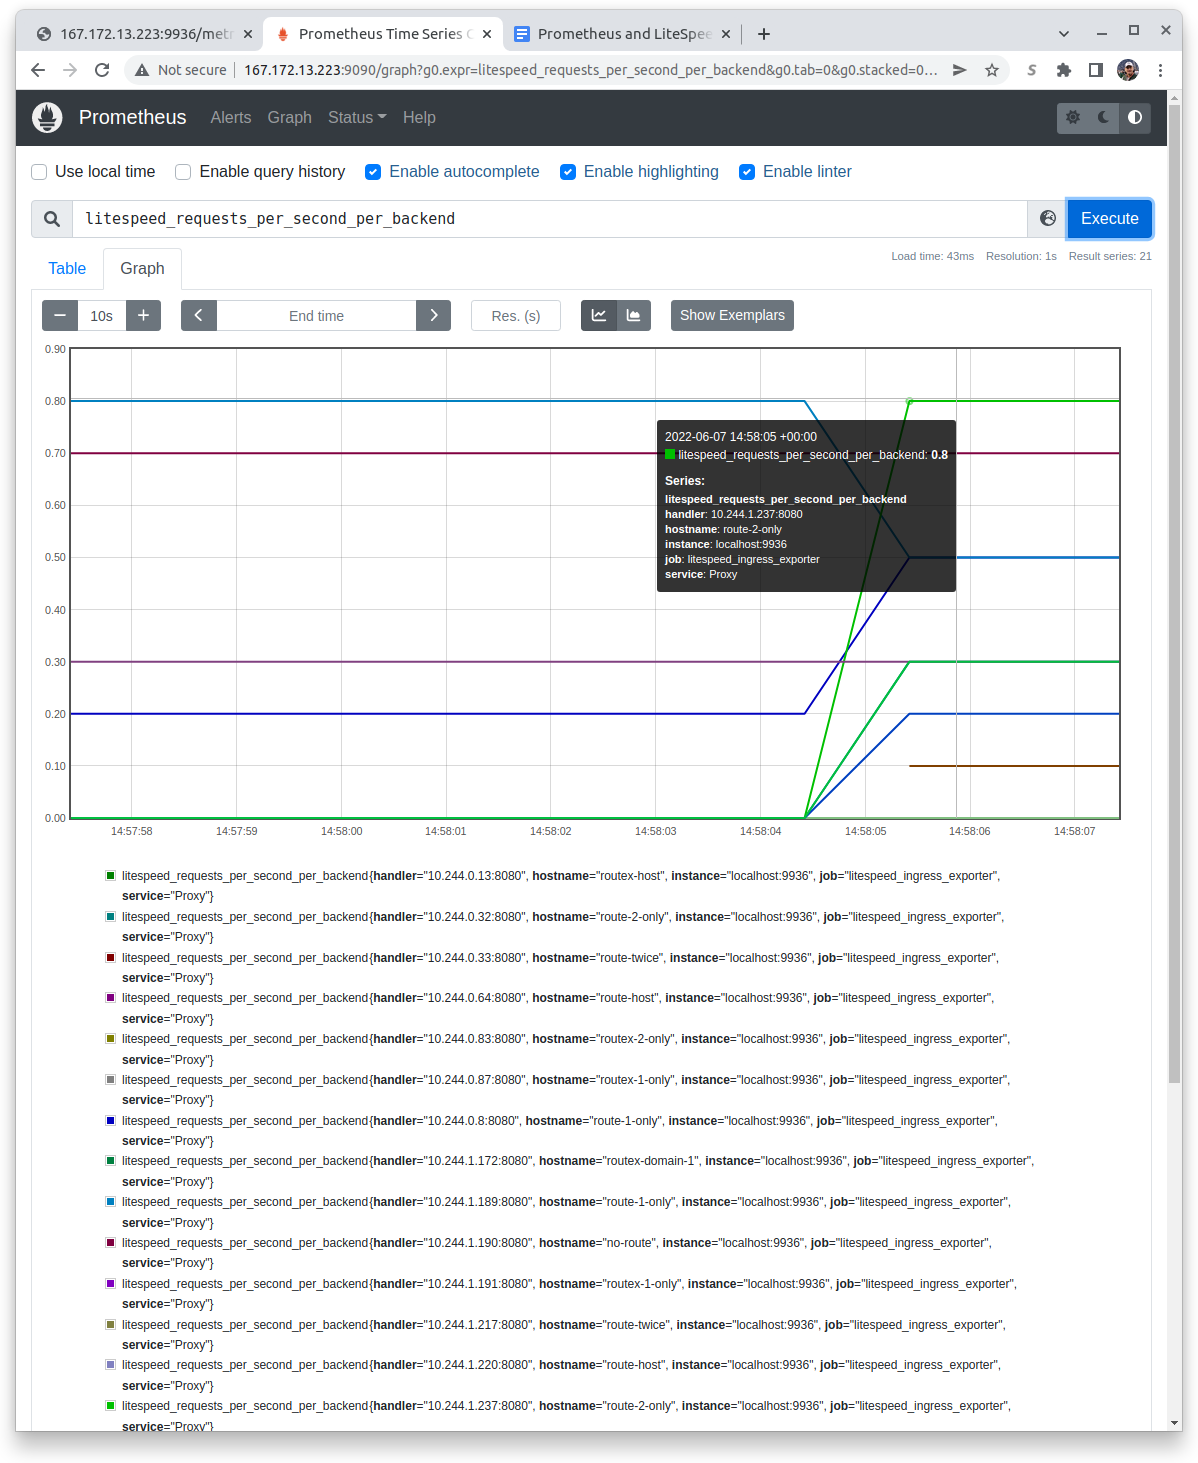
Select one option, for example, on a busy system select litespeed_requests_per_second_per_backend and press the Execute button:
Metrics Exported
Overall Metrics
The LiteSpeed metrics export includes the following overall metrics. In the .rtreport file, these metrics are at the top and don't repeat. For example:
VERSION: LiteSpeed Load Balancer//3.1.6
UPTIME: 02:52:56
BPS_IN: 0, BPS_OUT: 0, SSL_BPS_IN: 0, SSL_BPS_OUT: 2, L4_BPS_IN: 0, L4_BPS_OUT: 0
PLAINCONN: 1, SSLCONN: 1, L4CONN: 0, IDLECONN: 0
The titles to the table mean:
- Name is the Prometheus name for the metric. Each name will have a
litespeed_prefix. - Scraped Value is the source from the .rtreport file the value originates from
- Description is a simple description of the meaning of the parameter.
- Type is either
Gaugefor values which can go up or down orCounterfor values which can only go up.
| Name | Scraped Value | Description | Type |
|---|---|---|---|
| litespeed_current_http_connections | PLAINCONN | Current number of http connections | Gauge |
| litespeed_current_idle_connections | IDLECONN | Current number of idle connections | Gauge |
| litespeed_current_l4_connections | L4CONN | Current number of layer 4 connections | Gauge |
| litespeed_current_ssl_connections | SSLCONN | Current number of https connections | Gauge |
| litespeed_exporter_scrapes_failures_total | - | The number of failed scrapes. | Counter |
| litespeed_exporter_scrapes_total | - | The total number of scrapes. | Counter |
| litespeed_incoming_http_bytes_per_second | BPS_IN | Incoming number of bytes per second over HTTP | Gauge |
| litespeed_incoming_l4_bytes_per_second | L4_BPS_IN | Incoming number of bytes per second over layer 4 | Gauge |
| litespeed_incoming_ssl_bytes_per_second | SSL_BPS_IN | Incoming number of bytes per second over HTTPS | Gauge |
| litespeed_outgoing_http_bytes_per_second | BPS_OUT | Outgoing number of bytes per second over HTTP | Gauge |
| litespeed_outgoing_l4_bytes_per_second | L4_BPS_OUT | Outgoing number of bytes per second over layer 4 | Gauge |
| litespeed_outgoing_ssl_bytes_per_second | SSL_BPS_OUT | Outgoing number of bytes per second over HTTPS | Gauge |
| litespeed_up | - | Whether LiteSpeed is up or down (1 or 0) | Gauge |
| litespeed_version | VERSION | Returns whether LiteSpeed is up or down and the version field returns the text "LiteSpeed Load Balancer//3.1.6" | Gauge |
VHost (REQRATE) Metrics
The LiteSpeed metrics exported include the following VHost (virtual host) metrics. In the .rtreport file, these metrics repeat and have a REQ_RATE prefix with the first line representing the total and subsequent lines for VHosts which are defined and accessed in the conventional (non-ZeroConf) way; the only VHost which is included in the initial definition is named Example and is generally sparsely used. For example:
REQ_RATE []: REQ_PROCESSING: 1, REQ_PER_SEC: 3.1, TOT_REQS: 7079, PUB_CACHE_HITS_PER_SEC: 0.0, TOTAL_PUB_CACHE_HITS: 0, PRIVATE_CACHE_HITS_PER_SEC: 0.0, TOTAL_PRIVATE_CACHE_HITS: 0, STATIC_HITS_PER_SEC: 0.0, TOTAL_STATIC_HITS: 0
REQ_RATE [Example]: REQ_PROCESSING: 0, REQ_PER_SEC: 0.0, TOT_REQS: 8, PUB_CACHE_HITS_PER_SEC: 0.0, TOTAL_PUB_CACHE_HITS: 0, PRIVATE_CACHE_HITS_PER_SEC: 0.0, TOTAL_PRIVATE_CACHE_HITS: 0, STATIC_HITS_PER_SEC: 0.0, TOTAL_STATIC_HITS: 0, BPS_OUT: 0
Note that in the Prometheus table each VHost, including the overall one will be assigned a separate line; in the graph, each VHost will be assigned a separate color.
Each Prometheus Name will include, besides the litespeed_ prefix, a _per_vhost suffix.
| Name | Scraped Value | Description | Type |
|---|---|---|---|
| litespeed_current_requests_per_vhost | REQ_PROCESSING | Current number of requests in flight | Gauge |
| litespeed_outgoing_bytes_per_second_per_vhost | BPS_OUT | Current number of bytes per second outgoing. Only available for configured VHosts | Gauge |
| litespeed_private_cache_hits_per_second_per_vhost | PRIVATE_CACHE_HITS_PER_SEC | Private cache hits per second | Gauge |
| litespeed_private_cache_hits_per_vhost | TOTAL_PRIVATE_CACHE_HITS | Total private cache hits | Counter |
| litespeed_public_cache_hits_per_second_per_vhost | PUB_CACHE_HITS_PER_SEC | Public cache hits per second | Gauge |
| litespeed_public_cache_hits_per_vhost | TOTAL_PUB_CACHE_HITS | Total public cache hits | Counter |
| litespeed_requests_per_second_per_vhost | REQ_PER_SEC | Requests per second | Gauge |
| litespeed_static_hits_per_second_per_vhost | STATIC_HITS_PER_SEC | Static file requests per second | Gauge |
| litespeed_static_hits_per_vhost | TOTAL_STATIC_HITS | Total number of static file hits | Counter |
| litespeed_total_requests_per_vhost | TOT_REQS | Total number of requests | Counter |
Backend Metrics (EXTAPP)
LiteSpeed exports what is prefixed as external application metrics, but which are for Kubernetes actually backends. In Kubernetes, you use kubectl describe ingress INGRESS_NAME -n NAMESPACE to see the host names and the backends for each one. The .rtreport file continually updates statistics for these backends. For example:
EXTAPP [Proxy] [] [10.244.1.137:8080]: CMAXCONN: 100, EMAXCONN: 100, POOL_SIZE: 1, INUSE_CONN: 0, IDLE_CONN: 1, WAITQUE_DEPTH: 0, REQ_PER_SEC: 0.0, TOT_REQS: 51, SESSIONS: 1
EXTAPP [Proxy] [] [10.244.0.114:8080]: CMAXCONN: 100, EMAXCONN: 100, POOL_SIZE: 1, INUSE_CONN: 0, IDLE_CONN: 1, WAITQUE_DEPTH: 0, REQ_PER_SEC: 0.0, TOT_REQS: 67, SESSIONS: 1
EXTAPP [Proxy] [] [127.0.0.1:8088]: CMAXCONN: 200, EMAXCONN: 200, POOL_SIZE: 0, INUSE_CONN: 0, IDLE_CONN: 0, WAITQUE_DEPTH: 0, REQ_PER_SEC: 0.0, TOT_REQS: 414, SESSIONS: 1
EXTAPP [Proxy] [] [10.244.1.134:8080]: CMAXCONN: 100, EMAXCONN: 100, POOL_SIZE: 1, INUSE_CONN: 0, IDLE_CONN: 1, WAITQUE_DEPTH: 0, REQ_PER_SEC: 0.0, TOT_REQS: 43, SESSIONS: 2
EXTAPP [Proxy] [] [10.244.1.247:8080]: CMAXCONN: 200, EMAXCONN: 200, POOL_SIZE: 2, INUSE_CONN: 1, IDLE_CONN: 1, WAITQUE_DEPTH: 0, REQ_PER_SEC: 0.0, TOT_REQS: 51, SESSIONS: 2
EXTAPP [Proxy] [] [10.244.0.19:8080]: CMAXCONN: 100, EMAXCONN: 100, POOL_SIZE: 1, INUSE_CONN: 0, IDLE_CONN: 1, WAITQUE_DEPTH: 0, REQ_PER_SEC: 0.0, TOT_REQS: 31, SESSIONS: 2
EXTAPP [Proxy] [] [10.244.1.223:8080]: CMAXCONN: 0, EMAXCONN: 0, POOL_SIZE: 0, INUSE_CONN: 0, IDLE_CONN: 0, WAITQUE_DEPTH: 0, REQ_PER_SEC: 0.0, TOT_REQS: 118, SESSIONS: 2
EXTAPP [Proxy] [] [10.244.2.112:8080]: CMAXCONN: 100, EMAXCONN: 100, POOL_SIZE: 1, INUSE_CONN: 0, IDLE_CONN: 1, WAITQUE_DEPTH: 0, REQ_PER_SEC: 0.0, TOT_REQS: 39, SESSIONS: 1
The backend IP address is not terribly useful so in the exporter, while handler still displays the backend IP address, hostname displays the exported DNS name:
Note that in the graph, when you mouse-over a line, it displays the details for that particular backend.
Each Prometheus Name will include, besides the litespeed_ prefix, a _per_backend suffix.
| Name | Scraped Value | Description | Type |
|---|---|---|---|
| litespeed_config_max_connections_per_backend | CMAXCONN | Configured maximum number of connections | Gauge |
| litespeed_connections_idle_per_backend | IDLE_CONN | Number of idle connections | Gauge |
| litespeed_connections_in_use_per_backend | INUSE_CONN | Number of connections in use | Gauge |
| litespeed_current_sessions_per_backend | SESSIONS | Current number of sessions | Gauge |
| litespeed_pool_count_per_backend | POOL_SIZE | Total number of pools | Gauge |
| litespeed_pool_max_connections_per_backend | EMAXCONN | Maximum number of connections for the pool | Gauge |
| litespeed_requests_per_second_per_backend | REQ_PER_SEC | Number of requests per second | Gauge |
| litespeed_total_requests_per_backend | TOT_REQS | Total number of requests | Counter |
| litespeed_wait_queue_depth_per_backend | WAITQUE_DEPTH | Depth of the waiting queue | Gauge |