Dashboard
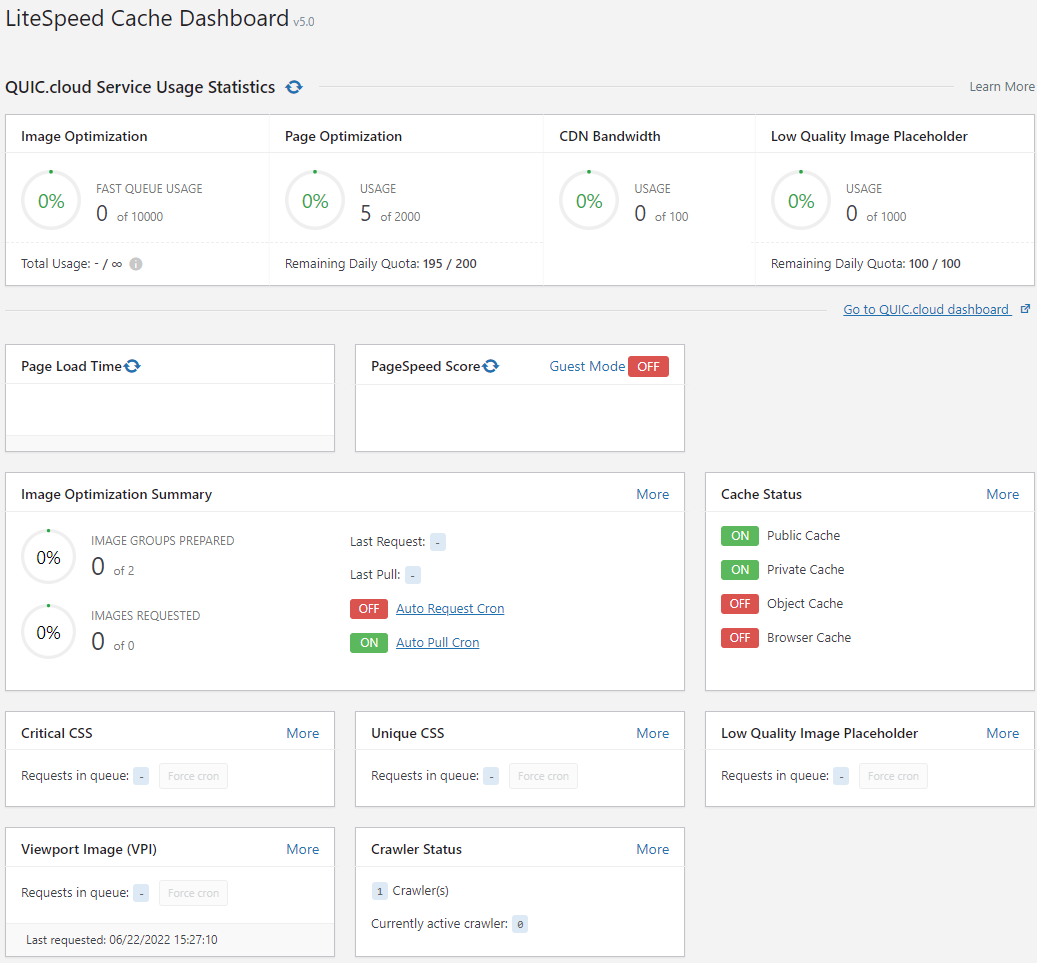
The LiteSpeed Cache Dashboard allows you to see the status of all of your LSCache and QUIC.cloud services at a glance.
Tip
This symbol allows you to refresh the content in the panel:
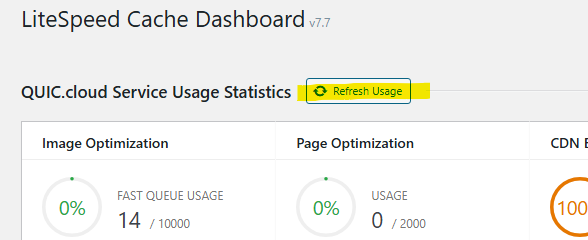
Click it to synchronize your site's Usage Statistics with QUIC.cloud's servers, or to recalculate your site's Page Load Time and PageSpeed Score.
Usage statistics
This area is a simplified version of the QUIC.cloud dashboard. It allows you to see what percentage of your resources have been used for each QUIC.cloud service for the current month.
QUIC.cloud services are purchased using credit. You are given an amount of free credit per service every month. If your site is powered by a LiteSpeed server, you get more credit than if you used another server (like Apache or nginx). See the QUIC.cloud docs to learn more about this tier system.
The free credit should be enough for most simple sites, but more credit may be purchased if you need it.
If you have signed up for a QUIC.cloud account, you can see your QUIC.cloud dashboard to get more details about your credit usage, and learn more about how to buy additional quota.
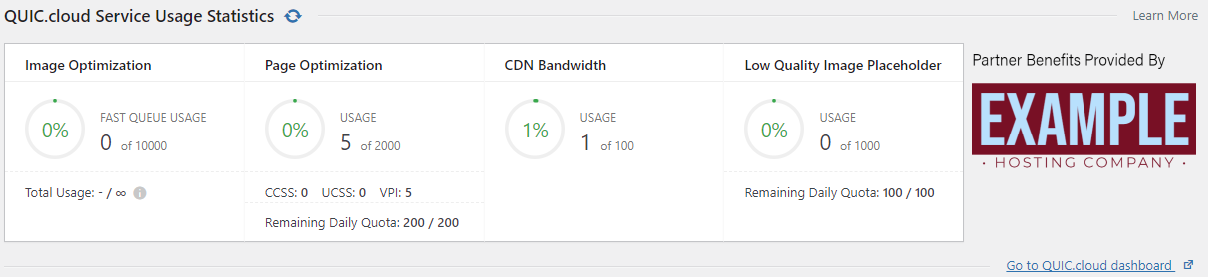
If you have joined a QUIC.cloud Partner Program via your hosting company, you will see their logo reflected to the right of the Usage Statistics area, as in the screenshot above.
Image optimization
There are two Image Optimization queues: the Standard Queue, which is free for everyone to use for any number of images, and the Fast Queue, which costs money to use. The Fast Queue, as its name implies, gets your images optimized more quickly.
You are given some free quota each month for Fast Queue usage. The amount of quota you receive depends on your domain's tier. You may purchase more with your account-level credit balance, if you wish.
The graphic shows Fast Queue usage for the month, while Total Usage indicates both Fast Queue and Standard Queue activity.
Page optimization
QUIC.cloud's Page Optimization services include Critical CSS Generation (CCSS), Unique CSS Generation (UCSS), and Viewport Images Generation (VPI).
You are given some free quota each month to put towards Page Optimization. (UCSS, CCSS, and VPI pull from the same combined quota pool.) The amount of quota you receive depends on your domain's tier. You may purchase more with your account-level credit balance, if you wish.
Page Optimization may be subjected to daily limits in order to keep server load from becoming problematic. Any limits will only apply to free quota, not to purchased quota, and will be displayed in this area. Learn more about daily limits at QUIC.cloud
CDN bandwidth
Unlike the other services, QUIC.cloud CDN usage is not measured in requests, but rather in GB of bandwidth.
You are given a certain amount of bandwidth for free each month to put towards CDN usage. The amount of bandwidth you receive depends on your domain's tier. You may purchase more with your account-level credit balance, if you wish.
Low quality image placeholder
You are given some free quota each month to put towards Low-Quality Image Placeholder Generation (LQIP) Requests. The amount of quota you receive depends on your domain's tier. You may purchase more with your account-level credit balance, if you wish.
Page load time
This area allows you to keep an eye on your home page load times. The Before calculation shows how long it takes for your home page to load if all LSCache optimization and caching features were disabled. After shows the home page load time using whatever options you currently have enabled in the LSCache plugin.
Tip
You may have noticed the small QUIC.cloud logo in this area. If you're having a problem with your QUIC.cloud services, try clicking the symbol to redetect your closest available service node(s). If your previously available node has gone down, a new node will be selected, and services can continue.
PageSpeed score
Your site's PageSpeed score is calculated with the PageSpeed API and displayed here for your information. The Before calculation shows your home page score if all LSCache optimization and caching features were disabled. After shows the home page score using whatever options you currently have enabled in the LSCache plugin.
Image optimization summary
This area gives you a more detailed overview of all of your image optimization activity.
Image Groups Prepared shows how many image groups have been prepared out of all of the image groups on your site. Images Requested shows how many image optimization requests have been received out of the total images on your site.
Auto Request Cron and Auto Request Pull are indicators of whether Image Optimization is running automatically or not. You can turn these settings ON or OFF in Image Optimization > Image Optimization Settings.
You will also see statistics about the most recent image optimization requests, and pulls.
Cache status
Use this panel to determine what types of caching are active on your site. Public Cache and Private Cache are both features of LiteSpeed's server-level page cache. Object Cache refers to external caching through Memcached, LSMCD, or Redis. Browser Cache is caching of static files on the client side.
Critical CSS
See how many requests you have waiting in the queue. If you have requests waiting, but you'd like them to be processed immediately, you can press the Force cron button. If you have requested Critical CSS in the past, you will see additional statistics including the time of the last generation and how long it took to execute in seconds.
Unique CSS
See how many requests you have waiting in the queue. If you have requests waiting, but you'd like them to be processed immediately, you can press the Force cron button. If you have requested Unique CSS in the past, you will see additional statistics including the time of the last generation and how long it took to execute in seconds.
Low quality image placeholder
See how many requests you have waiting in the queue. If you have requests waiting, but you'd like them to be processed immediately, you can press the Force cron button. If you have requested LQIPs in the past, you will see additional statistics including the time of the last generation and how long it took to execute in seconds.
Viewport images
See how many requests you have waiting in the queue. If you have requests waiting, but you'd like them to be processed immediately, you can press the Force cron button. If you have requested Viewport Images in the past, you will see additional statistics including the time of the last generation and how long it took to execute in seconds.
Crawler status
This panel shows you the number of crawlers you have defined, and which crawler is currently running. If no crawler is currently running, Currently active crawler will be 0. If available, you will also see statistics about the most recent crawl including start time, interval time, and reason for the crawler's end.