LiteSpeed Containers
The WHM Plugin enables easy management of LiteSpeed Containers:
- Configure Limits for Each User
- Configure cPanel Packages with useful user defaults
- Obtain LiteSpeed Containers statistics
Warning
You do not need LiteSpeed Containers if you are currently using CloudLinux CageFS/LVE. These systems provide similar features and cannot be used at the same time.
Configuring Limits for Each User
In the WHM LiteSpeed Plugin there is a section for LiteSpeed Containers.
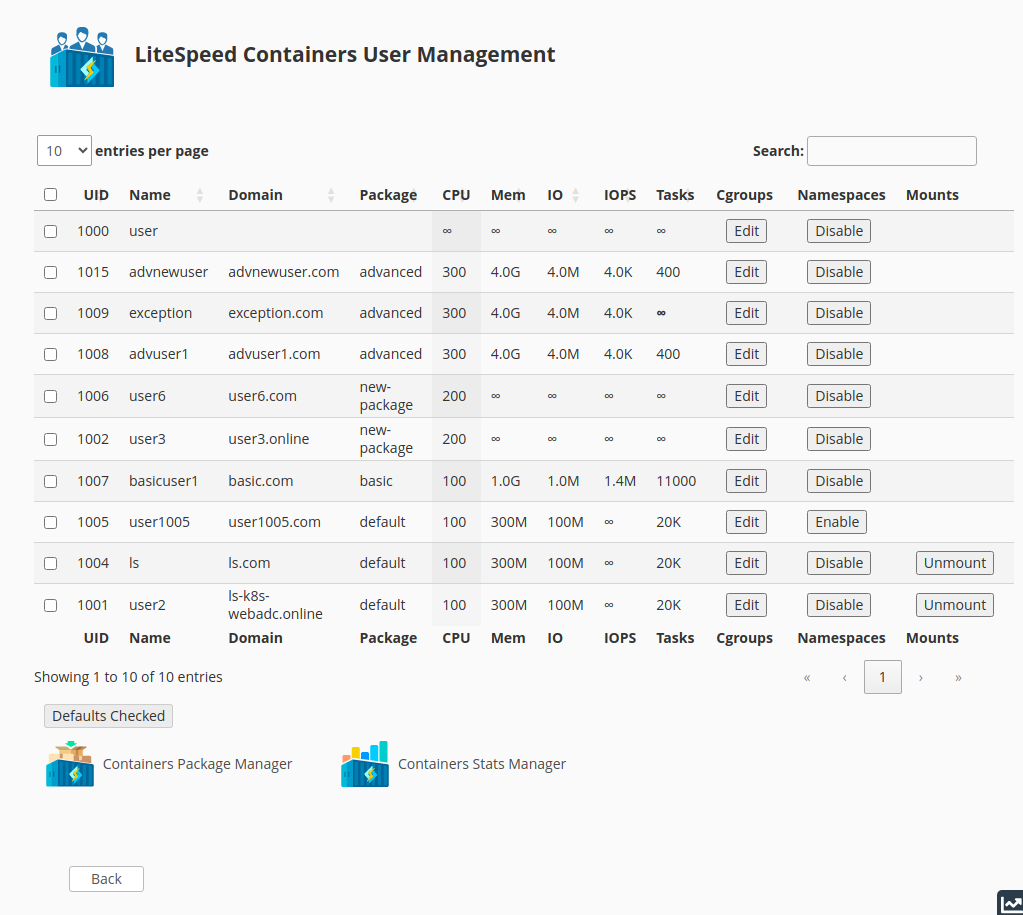
Select Containers User Manager to enter the primary LiteSpeed Containers Management tool.
When you hover your mouse over a column title it will describe its purpose:
- UID: OS system user ID.
- Name: OS system user name.
- Domain: cPanel defined web site domain.
- Package: cPanel defined package.
- CPU: CPU percentage.
100represents one CPU and is the recommended minimum. The infinity sign (∞) indicates no limit enforced by cgroups. Bold values are those different from the package default. - Mem: Virtual memory value in bytes and may have a
K,M,GorTsuffix. The infinity sign (∞) indicates no limit enforced by cgroups. Bold values are those different from the package default. - IO: Read or Write maximum bandwidth value in bytes and may have a
K,M,GorTsuffix. The infinity sign (∞) indicates no limit enforced by cgroups. Bold values are those different from the package default. - IOPS: Read or Write maximum per second value in bytes and may have a
K,M,GorTsuffix. The infinity sign (∞) indicates no limit enforced by cgroups. Bold values are those different from the package default. - Tasks: Maximum number of tasks (processes) and may have a
K,M,GorTsuffix. The infinity sign (∞) indicates no limit enforced by cgroups. Bold values are those different from the package default. - CGroups: The Edit button lets you modify the values for the row's user.
- Namespaces: The Disable button will disable namespaces for the specific user if it is enabled in LiteSpeed Configuration; if the button is Enable, then you can reenable namespaces for this user. Enabling it here does not enable the configuration for the user, it simply turns off the disabling which can be done here.
- Mounts: The Unmount button will be displayed if the user has a mounted namespaces environment. You might unmount it to refresh values from a change to a namespaces configuration file.
Each row represents the current cgroups value and namespace status for the user.
The first column contains a checkbox. If you check one or more user's checkboxes, you can then press the Defaults Checked button to set all of the users checked to their package defaults.
There are icons for Containers Package Manager and Containers Stats Manager which are there as a convenience to jump within the features of the LiteSpeed Containers facility. You can also press the Back button to return to the LiteSpeed Web Server Plugin main screen.
LiteSpeed Containers Setup Script
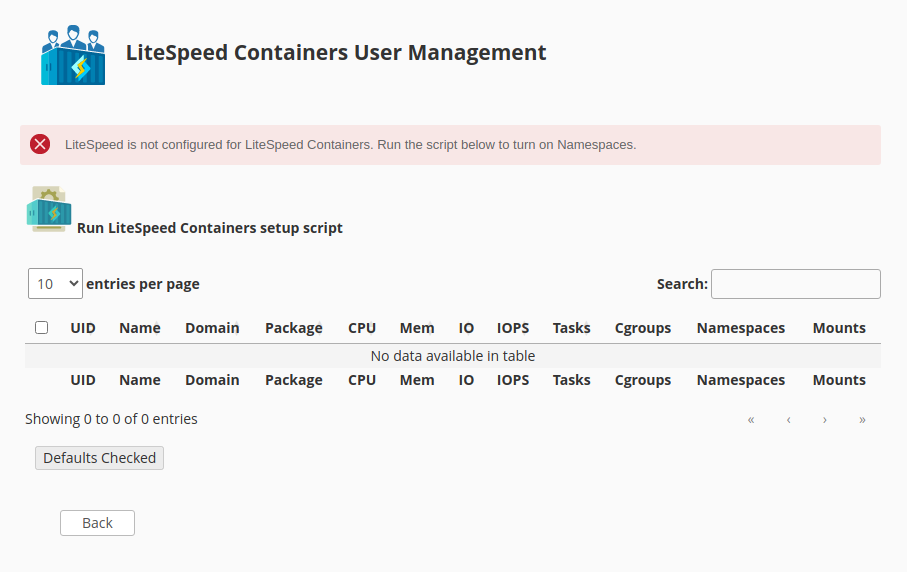
If you need to execute additional setup steps, you may see a message that says something like:
LiteSpeed is not configured for LiteSpeed Containers. Run the script below to turn on Namespaces.
Double-click the icon labeled Run LiteSpeed Containers Setup Script. It will do the following:
- Confirm you wish to run it
- Modify the LiteSpeed Configuration if necessary
- Update the cgroups settings if necessary
- Return you to the screen with all features enabled.
If the Setup script reports Not a LiteSpeed Containers capable system and shows that you are missing support for cgroups v2 and you are running a version 8 variant of RedHat Linux (RedHat, CentOS, AlmaLinux, etc.), this will explain how to boot into cgroups v2.
Modifying the limits for a user
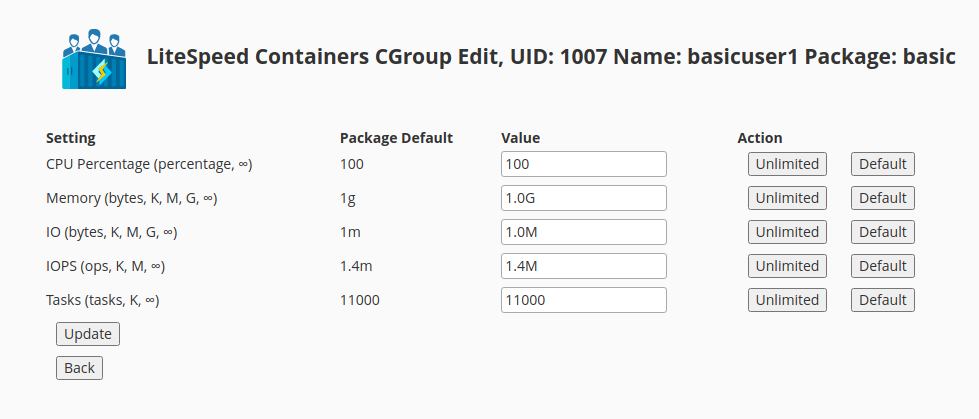
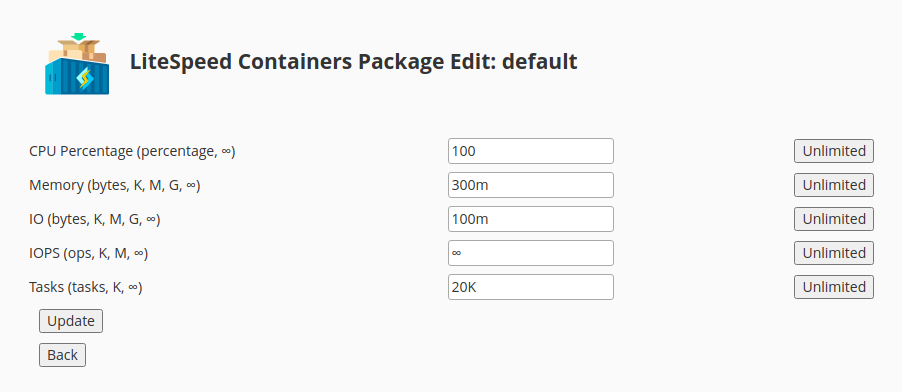
To modify the operating-system-enforced limits in the screenshot above for the user ls press the Edit button.
The title shows the UID, the user name and the package of the user being edited. You can specify the value for each field or press the button to the right of the field to set the value to Unlimited (either the text unlimited or ∞) or the Default for the package. Values can be specified as numbers, or a number with a K, M, G or T suffix. The rows are as described in the column titles above.
When you have set the values to the desired settings you can press the Update button which will immediately apply the specified values to the operating system and they will take effect immediately. For example if you change the CPU percentage and the user is using their maximum CPU values, a top command will show the value immediately change.
You can also press the Back button to return to the prior screen with no changes applied.
Configuring cPanel Packages With Useful User Defaults
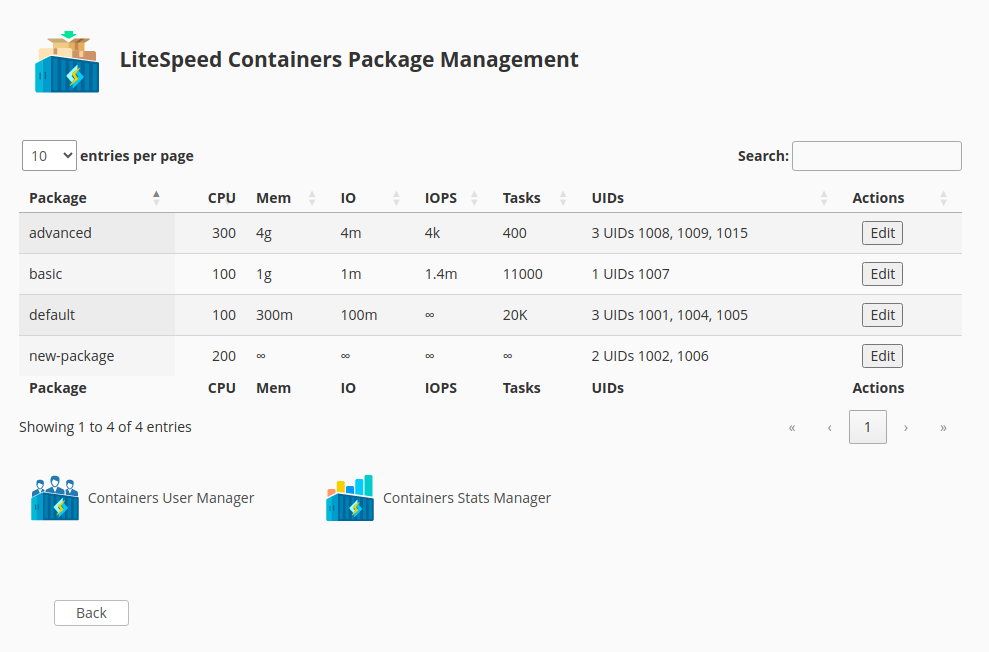
Select Containers Package Manager to enter the package management tool:
In the Package Manager each row is a cPanel package and each column represents the default settings for that package. When you enter the package manager for the very first time, all of the settings will be unlimited (∞) as the configuration of LiteSpeed Container package defaults has not been done yet.
The columns are the same as for the User Manager except the UIDs column. It contains a count of UIDs in the package and up to 3 of the UIDs; all others are not shown to avoid crowding.
To create package defaults, press the Edit button for the row containing package you wish to modify.
As for the user manager edit, each row represents the resource limit default you wish to set and you press enter a number, a numeric magnitude followed by K, M, G or T or press the Unlimited button to set the resource limit default to unlimited. When you have completed your changes you can press Update to save the default values or Back to return to the Package Manager without making changes.
These settings are more than package defaults, unless overridden in the Containers User Manager the values take effect immediately for the users in the package. There are hooks installed in cPanel so that new users get these values immediately applied and deleted users are removed.
Obtaining LiteSpeed Containers Statistics
The LiteSpeed Prometheus Exporter will generate cgroups statistics, so if you wish statistics for users using cgroups, you need only install it. Full installation instructions and documention are available here. To take advantage you will need to install Prometheus and use it to import the data made available by the exporter. This is the recommended method as there is a user interface here, and you can use the rich range of tools like Grafana available in the Prometheus universe.
Prometheus is not required to get a quick look at the usage of the system. A quick 2-second snapshot is also available.
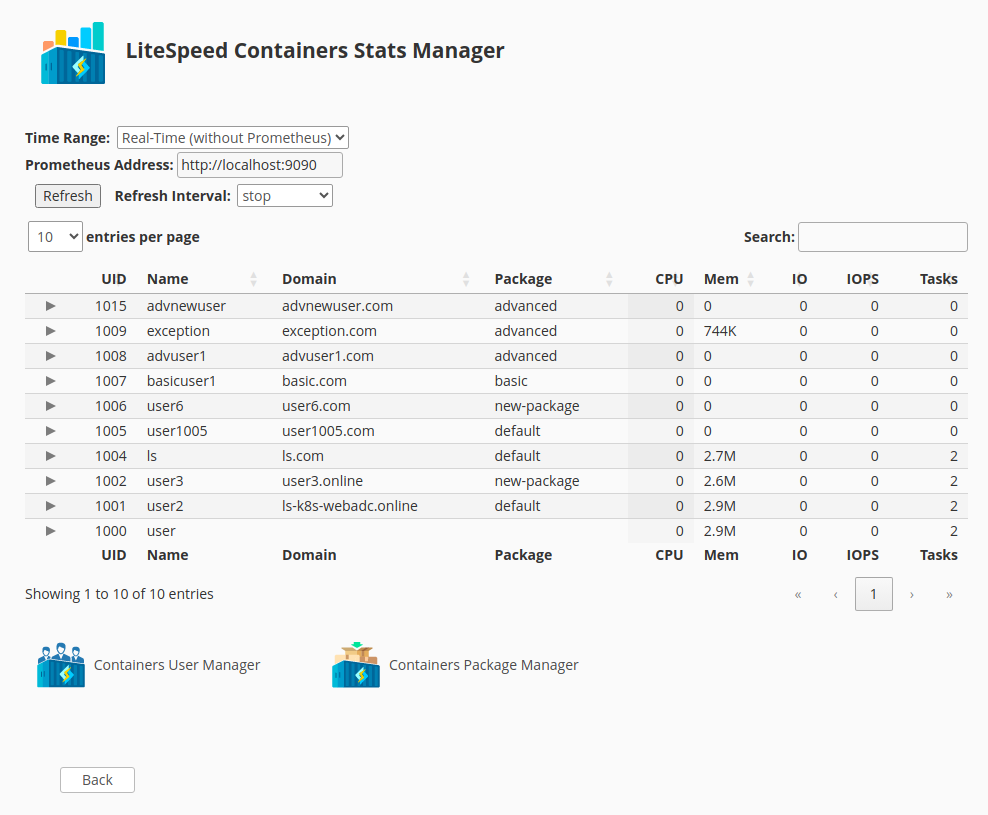
In the WHM plugin, LiteSpeed Containers group there is the Containers Stats Manager.
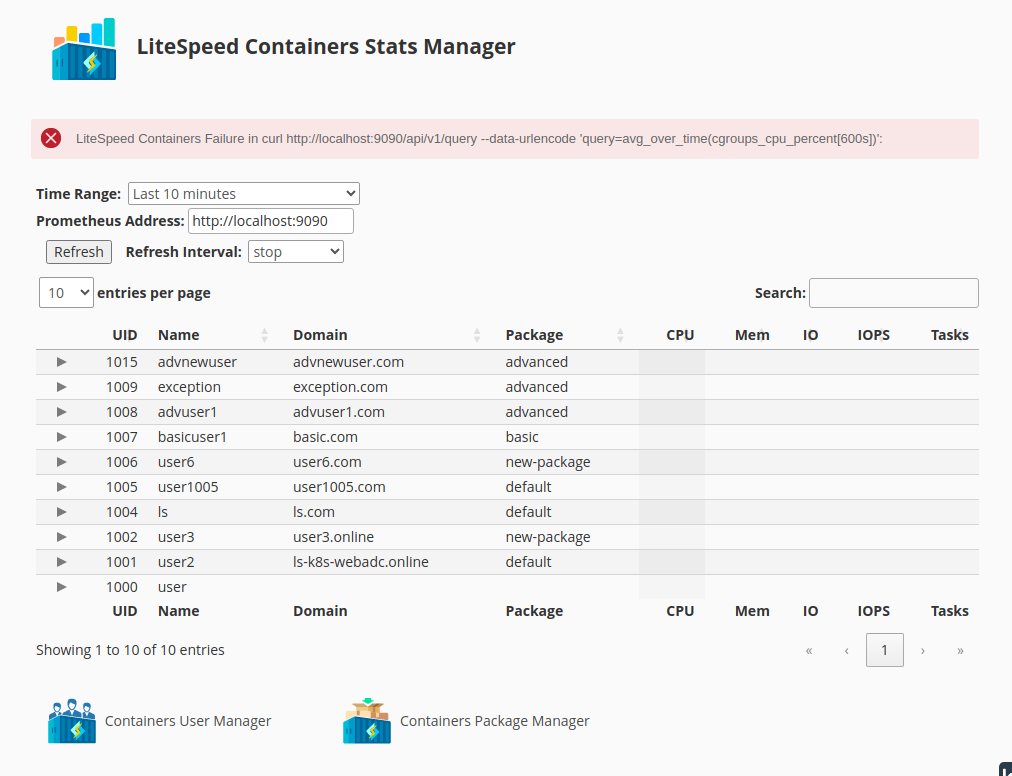
If you do not have Prometheus running on the system it is configured for, you will see an error message and there will be no values in the statistical columns.
Options include:
Time Range: A pulldown letting you select the information time range for Prometheus except for the last one. The values available are remembered on this browser between exit and re-enter events when possible.
Last 10 minutes: Most recent 10 minutes worth of information from when you entered or last pressed Refresh. This is the default when you first enter this screen.Last 30 minutes: Most recent 30 minutesLast hour: Most recent 60 minutesLast 4 hours: Most recent 4 hoursToday: The time between midnight and now.Yesterday: The time between yesterday at this time and now.Real-Time (without Prometheus): The most recent 2 seconds worth of data scraped from the cgroups information in the system. This will work even if Prometheus is not installed.
Prometheus Address: Only available when you specify a time range, the address and port of the instance where you run Prometheus. The default is localhost:9090.
Refresh Press this button to perform a new query of the statistical engine.
Refresh Interval: A pulldown letting you select the time range for how often the screen will be refreshed without you having to press the Refresh button. When you select a refresh interval it takes effect without having to press the Refresh button again.
stop: The default and indicates that no automatic refreshes will be performed.10,15,30and60 secondsas well as2and5 minutesindicate how often auto-refreshes will be performed. An initial refresh is performed immediately.
The cgroups columns mean what they mean in the prior screens, but in this context they represent the real values for the time range, and not the maximums:
- CPU: Average CPU percentage for the time interval and method specified.
100represents one CPU. - Mem: Average virtual memory value in bytes for the time interval and method specified.
- IO: Average combined read and write bandwidth value in bytes for the time interval and method specified.
- IOPS: Average combined read and write per second value in bytes for the time interval and method specified.
- Tasks: Average number of tasks (processes) for the time interval and method specified.
The triangle icon on the screen in the first column can be used to display the current maximum values for that user to allow you to compare the actual values with the maximums.

